
Sphere of action: Waste disposal
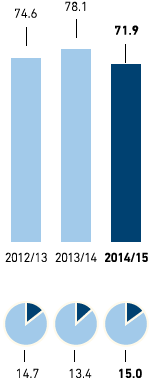
Amount of waste and recycling rate (in kg per m2 selling space and in %)
METRO GROUP
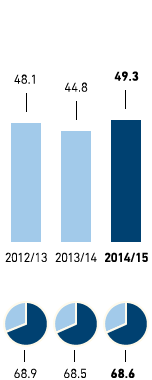
Germany
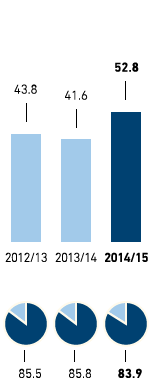
Western Europe
(excl. Germany)
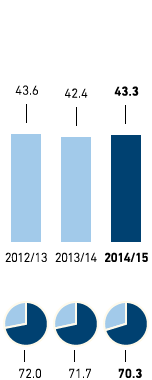
Eastern Europe
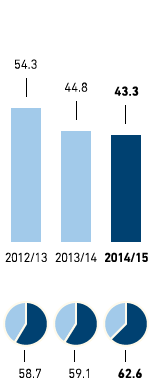
Asia/Africa
Definition:
Waste generated in relation to selling space. The amount of waste is made up of waste for disposal, for recycling or heat recovery, hazardous and organic waste. The recycling rate is the amount of waste for recycling and heat recovery and the organic waste as compared to the overall quantity of waste.
Explanation:
The amount of waste per square metre of selling space increased by close to 5 kilogrammes in the reporting period compared with the previous year. Among other things, this is due to the increase in delivery and online business at METRO Cash & Carry and Media-Saturn. The increases in these business activities coupled with unchanged or even declining selling space have resulted in this key performance indicator growing.
The volume of waste in absolute terms fell to 526,665 tonnes. This can be broken down as follows:
- waste for disposal (106,114 tonnes)
- waste for recycling or heat recovery (286,192 tonnes)
- organic waste (75,049 tonnes)
- hazardous waste (59,310 tonnes)