
METRO GROUP’s carbon footprint
Carbon footprint and climate protection target
In 2012, METRO GROUP resolved to reduce its greenhouse gas emissions by 20 per cent per square metre of selling space by 2020. The basis for this calculation is our level of emissions as measured in 2011. In CO2 equivalents, this means that we want to reduce emissions from 330 kilograms of CO2 equivalents per annum in 2011 to 264 kilogrammes. We already almost achieved this target in financial year 2014/15.
The climate protection target refers to emissions that are central to our activities as a retail company and, above all, that we can influence directly. These are emissions from:
- Consumption of heating oil, natural gas, liquefied petroleum gas, electricity, district heating and cooling, and paper
- Refrigerant losses from commercial refrigeration and air-conditioning
- Fuel consumption by company cars and emergency power generators
- Upstream chain emissions and network losses for all direct and indirect energy sources
- Business travel
METRO GROUP has been recording and publishing its greenhouse gas emissions since as far back as 2008. In doing so, we take into account all the main greenhouse gas emissions that we cause directly and indirectly in the course of our business activities. This detailed documentation forms the basis for our goal of minimising our impact on the climate. The emissions that are actively managed under the climate protection target make up almost 40 per cent of overall emissions. Our carbon footprint reporting also covers the following additional emission sources:
- Fuel consumption by the company’s fleet of trucks
- Overall external logistics
- Goods and services purchased for our own use (not including paper, as this is included in the climate protection target)
- Capital assets
- Waste
- Commuting by employees
- Leased assets
Methodology and scope
Our reporting is based on the Corporate Accounting and Reporting Standard and the Corporate Value Chain (Scope 3) Accounting and Reporting Standard of the Greenhouse Gas Protocol. The emissions from all sales lines, service companies and back offices are taken into account. With the aid of the group-wide Carbon Intelligence System introduced in 2011, we record consumption data for the aforementioned emission sources at virtually all stores, department stores, back offices and warehouses. If recording primary data is highly complex or not possible, we model these emission sources. For example, we derive the emissions of purchased goods and services, assets and leased assets from the key performance indicators for METRO GROUP’s economic value added using an economic input-output model that draws on the economic flows of goods and services.
We report on the overall effect of all greenhouse gas emissions in the form of CO2 equivalents in order to gauge the impact of other greenhouse gases as well as CO2.
Since 2011, our carbon footprint has been subject to an audit by KPMG AG Wirtschaftsprüfungsgesellschaft. Additionally, we have been making transparent disclosures about our climate protection strategy, the risks and opportunities offered by climate change, and the management of our emissions via CDP (formerly the Carbon Disclosure Project) since 2006 and have been named Climate Disclosure Leader on a number of occasions as a result. CDP is an international independent non-profit organisation that assesses whether companies are dealing with the opportunities and risks of climate change effectively and how transparently they report on this.
Developments in greenhouse gas emissions
From October 2014 to September 2015, METRO GROUP was responsible for a total of 7.6 million tonnes of CO2 equivalents (previous year’s period: 8.4 million tonnes). These comprise emissions caused directly (in accordance with Scope 1) in the amount of 0.9 million tonnes of CO2 equivalents and indirect emissions (Scope 2) totalling 1.5 million tonnes of CO2 equivalents. A further 5.2 million tonnes of CO2 equivalents relate to other indirect emissions (Scope 3). We have reduced our emissions by more than 2 million tonnes compared with the reference year 2011.
Carbon footprint
Greenhouse gas emissions in t CO2 (CO2 equivalents)
| Download XLS (22KB) |
|
|
Reference Year 2011 |
2012/13 |
2013/14 |
2014/15 |
|
Scope 1 – direct greenhouse gas emissions |
1,084,509 |
1,066,741 |
1,015,598 |
871,837 |
|
Scope 2 – indirect greenhouse gas emissions |
2,432,102 |
2,070,414 |
1,786,594 |
1,495,710 |
|
Scope 3 – other indirect greenhouse gas emissions |
6,113,122 |
5,531,592 |
5,562,362 |
5,151,775 |
|
Total greenhouse gas emissions |
9,629,733 |
8,668,747 |
8,364,553 |
7,519,322 |
The emissions actively managed as a result of the climate protection target total 265 kilograms of CO2 equivalents per square metre of selling space (previous year’s period: 273 kilograms of CO2 equivalents). As such, we are close to achieving our target of 264 kilograms per square metre of selling space.
Status of climate protection target
Greenhouse gas emissions in kg CO2 (CO2 equivalents) per m2 selling space
METRO GROUP
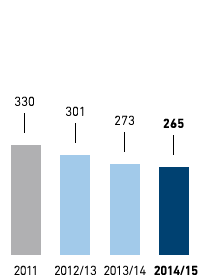
Germany
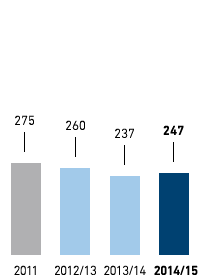
Western Europe
(excl. Germany)
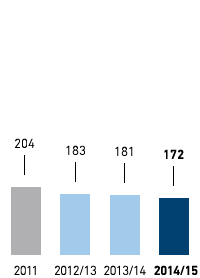
Eastern Europe
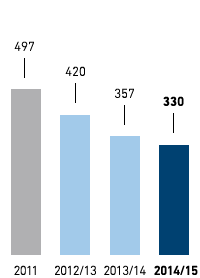
Asia/Africa
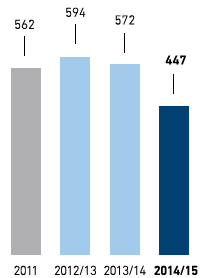
The significant decline in emissions compared with the reference year 2011 can essentially be attributed to three factors:
- Measures to reduce consumption with respect to energy, company cars, paper and business travel and emissions from refrigerant loss (fall of approximately 12.6 per cent)
- General technical and scientific developments as reflected by the adjustment of the emission factors used to calculate CO2 equivalents (drop of 4.9 per cent)
- Changes in the portfolio of locations, in particular the sale of locations in Eastern Europe and Turkey, which tend to be responsible for high emissions (drop of 2.2 per cent)
The reduction of greenhouse gas emissions is also reflected positively in the operating costs. For example, our sales line METRO Cash & Carry has cut its electricity consumption per square metre of selling space by approximately 17 per cent since 2011. This equates to savings of around €80 million since 2011.
As a concrete example, the two modern small-scale CHP plants in Berlin-Marienfelde and Düsseldorf cover more than 25 per cent of the respective stores’ electricity requirements and all of their heating needs. The plants avoid generating approximately 300 tonnes of greenhouse gas emissions each compared with taking electricity from the grid, thanks to their highly efficient cogeneration. Energy procurement costs are thus reduced by up to 4 per cent.
We will remain committed to climate protection and will reduce our greenhouse gas emissions further in the years to come. In view of the climate negotiations in Paris, METRO GROUP will draw up a new climate protection target and will continue to play its part in limiting climate change even after 2020.