
Employees
Employees
METRO GROUP
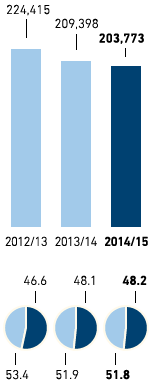
Germany
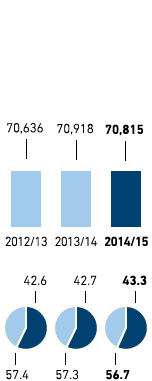
Western Europe
(excl. Germany)
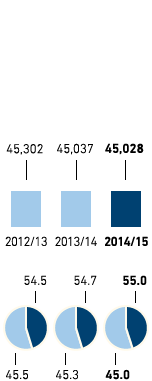
Eastern Europe
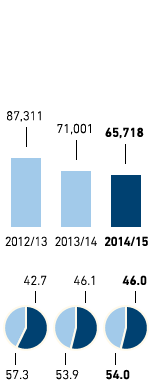
Asia/Africa
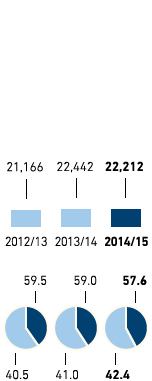
Definition:
Full-time equivalent employees, average for the year, excluding trainees.
Explanation:
The Galeria Kaufhof sales line was sold in financial year 2014/15. All the employee KPIs for the previous years were also adjusted.
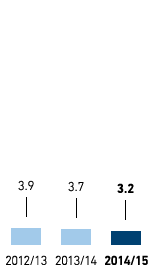
Part-time rate (in %)
METRO GROUP
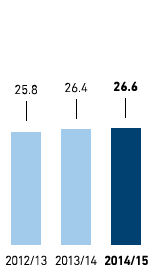
Germany
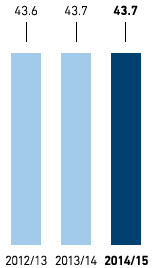
Western Europe
(excl. Germany)
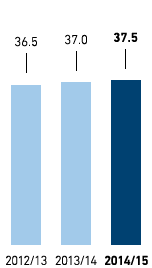
Eastern Europe
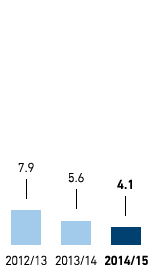
Asia/Africa
Definition:
Share of part-time employees, average for the year, excluding trainees.
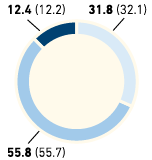
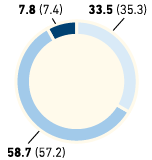
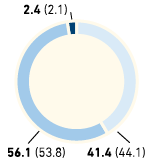
Employees by age group (in %)
METRO GROUP
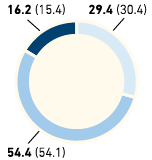
Germany
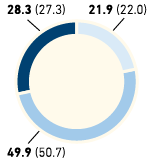
Western Europe
(excl. Germany)
Eastern Europe
Asia/Africa
Definition:
Breakdown of employees by age group, average for the year, including trainees.
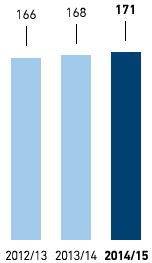
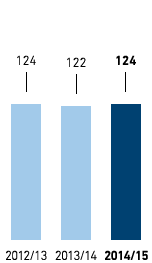
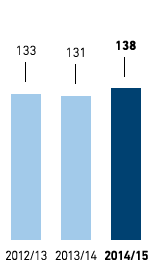
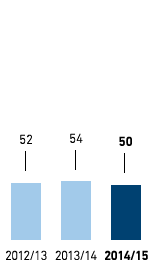
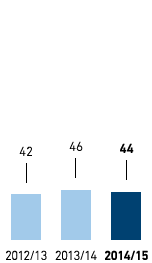
Number of nationalities
METRO GROUP
Germany
Western Europe
(excl. Germany)
Eastern Europe
Asia/Africa
Definition:
Number of different nationalities among our employees, excluding trainees, as of 30 September.
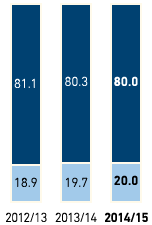
Gender breakdown in managerial positions (in %)
METRO GROUP
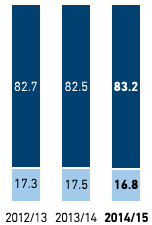
Germany
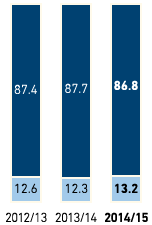
Western Europe
(excl. Germany)
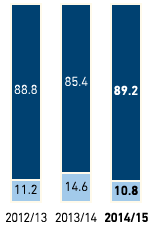
Eastern Europe
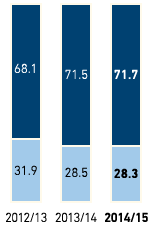
Asia/Africa
Definition:
Managerial positions are those in levels 1–3 (Management Board, General Management, divisional management, departmental management and store management). The percentage of male and female employees in these positions is calculated (per capita as of 30 September).
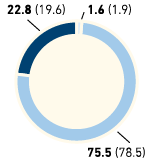
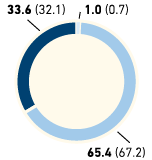
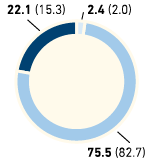
Managers by age group (in %)
METRO GROUP
Germany
Western Europe
(excl. Germany)
Eastern Europe
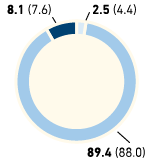
Asia/Africa
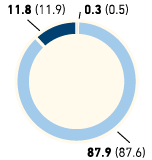
Definition:
Breakdown of managers by age group as of 30 September.
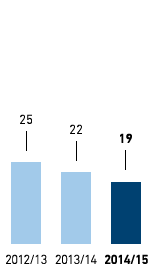
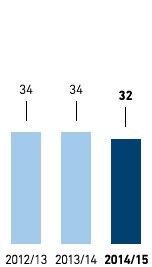
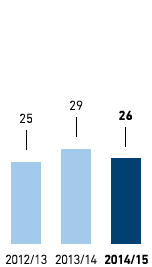
Number of nationalities among managers
METRO GROUP
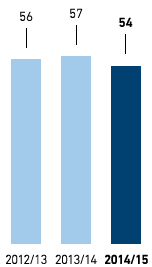
Germany
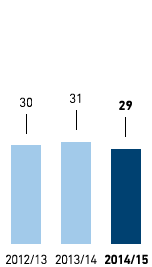
Western Europe
(excl. Germany)
Eastern Europe
Asia/Africa
Definition:
Number of different nationalities among our managers as of 30 September.
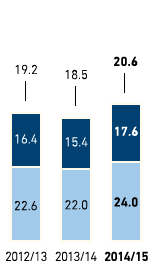
Staff turnover by region and gender (in %)
METRO GROUP
Germany
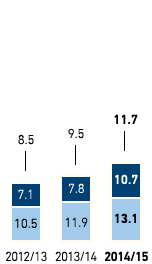
Western Europe
(excl. Germany)
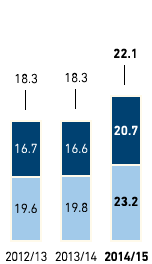
Eastern Europe
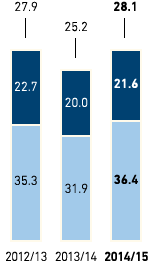
Asia/Africa
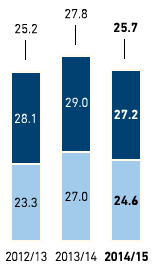
Definition:
Staff turnover is defined as all staff leaving, that is those who retire, die or resign / are dismissed. The staff turnover rate is the number of workers leaving in relation to the average number of employees. All employees on permanent contracts are included.
Explanation:
The staff turnover rate is high at METRO GROUP. This is primarily attributable to the fact that the staff turnover is generally high in several Asian and Eastern European countries where METRO GROUP operates.
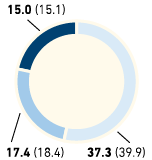
Staff turnover by region and age group (in %)
METRO GROUP
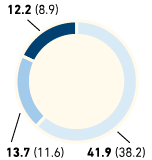
Germany
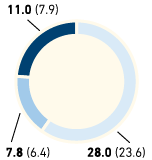
Western Europe
(excl. Germany)
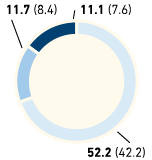
Eastern Europe
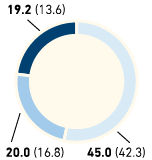
Asia/Africa
Definition:
Employees leaving due to retirement, death or resignation/dismissal, broken down by age and region. The staff turnover rate is the number of workers leaving in relation to the average number of employees.
Work-related accidents
Germany
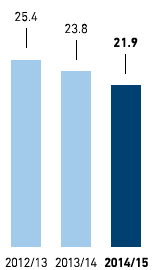
Definition:
Number of reportable work-related accidents per 1,000 employees as compared to the number of full-time equivalent employees, average for the year. Accidents on the way to or from work are not included.
Explanation:
The number of accidents per 1,000 full-time equivalent employees at the German METRO GROUP companies is 21.9. Based on the actual headcount, there were 18.5 accidents per 1,000 employees. Because of the widely varying definitions of “work-related accident” in the countries in which METRO GROUP operates, we currently only report this KPI for Germany. We are working on a uniform group-wide reporting approach.
Continuing professional development (CPD)
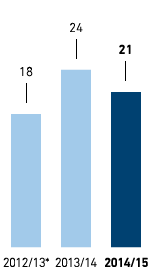
Average number of hours of CPD per employee per year
Average CPD expenditure per employee per year in €
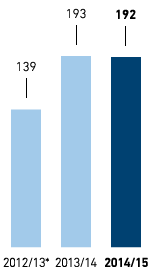
* January to September 2013 only due to change in financial year
Definition:
Training (hygiene, occupational safety, etc.) and courses focusing on ongoing operations plus medium- and long-term CPD opportunities that are offered with a view to enhancing the course of business.
Explanation:
For METRO GROUP, CPD is important from the perspective of a sustainable staffing policy. At present, we collate this KPI for the employees of METRO Cash & Carry and METRO AG in 28 countries. Close to 650,000 members of staff received training on management and leadership topics and functional roles in financial year 2014/15.
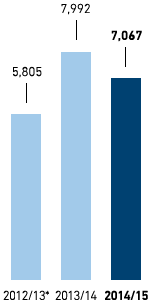
Vocational trainees
Trainees in Germany
* Germany only
Definition:
All trainees including interns and students.
Explanation:
The German companies’ training rate was 7.6 per cent in financial year 2014/15.