
Sphere of action: Transport, warehousing, stores
Carbon footprint
Greenhouse gas emissions in t CO2 (CO2 equivalents)
| Download XLS (22KB) |
|
|
Reference Year 2011 |
2012/13 |
2013/14 |
2014/15 |
|
Scope 1 – direct greenhouse gas emissions |
1,084,509 |
1,066,741 |
1,015,598 |
871,837 |
|
Scope 2 – indirect greenhouse gas emissions |
2,432,102 |
2,070,414 |
1,786,594 |
1,495,710 |
|
Scope 3 – other indirect greenhouse gas emissions |
6,113,122 |
5,531,592 |
5,562,362 |
5,151,775 |
|
Total greenhouse gas emissions |
9,629,733 |
8,668,747 |
8,364,553 |
7,519,322 |
Definition:
Level of all main emissions by Scope in line with the methodology of the Greenhouse Gas Protocol.
The following sources of emissions are included:
- Scope 1 = heating oil, natural gas, liquefied petroleum gas (LPG), refrigerant losses from commercial refrigeration, refrigerant losses from air-conditioning, fuel consumption of company cars and the group’s own logistics fleet, emergency power generators
- Scope 2 = electricity consumption, district heating and cooling
- Scope 3 = all external logistics, paper consumption for advertising and photocopying, business trips, goods and services purchased for own use, capital assets, upstream chain emissions and grid losses for all direct and indirect energy sources, waste, staff commutes, leased assets
Explanation:
There are differences compared with the figures reported in previous years due to changes in the emission factors. For example, we adjusted the emission factors for waste with retrospective effect going back to 2011. As such, these emission volumes are now lower than previously reported. This is due to a 2012 change in the accounting system of the emission factors database used by us. Emissions relating to waste processing are no longer the responsibility of METRO GROUP and must instead be accounted for by the waste disposal company.
Status of climate protection target
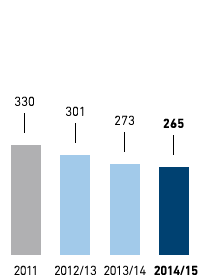
Greenhouse gas emissions in kg CO2 (CO2 equivalents) per m2 selling space
METRO GROUP
Germany
Western Europe
(excl. Germany)
Eastern Europe
Asia/Africa
Definition:
Greenhouse gas emissions from METRO GROUP’s stores, back offices and warehouses (by selling space) included within the climate protection target. Included are the emissions from electricity and heating energy consumption, also counting upstream chains and grid losses, refrigerant emissions from commercial refrigeration and air-conditioning, fuel consumption by company cars, paper consumption for advertising material and photocopying as well as business trips.
Explanation:
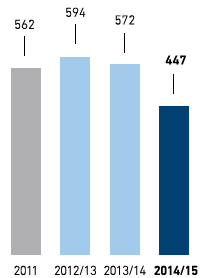
We aim to reduce our specific greenhouse gas emissions by 20 per cent between 2011 and 2020. In concrete terms, this means that we want to cut our emissions per square metre of selling space from 330 to 264 kilograms of CO2 equivalents per annum.
Between October 2014 and September 2015, METRO GROUP generated 265 kilograms of CO2 equivalents per square metre of selling space. As such, we have almost achieved our target. The significant decline in emissions compared with the reference year 2011 can essentially be attributed to three factors:
- Measures to reduce consumption relating to energy, company cars, paper and business travel, and to reduce emissions caused by refrigerant loss
- General technical and scientific developments as reflected by the adjustment of the emission factors used to calculate CO2 equivalents
- Changes in the portfolio of locations, in particular the sale of locations in Eastern Europe and Turkey, which tend to be responsible for high emissions
Trends in the emission sources included in the climate protection target
Greenhouse gas emissions in kg CO2 (CO2 equivalents) per m2 selling space
| Download XLS (22KB) |
|
|
Reference Year 2011 |
2014/15 |
Change in % |
|
Electricity consumption |
211.9 |
155.4 |
−26.6 |
|
Thermal energy consumption |
28.1 |
28.4 |
1.3 |
|
Company cars |
7.1 |
7.6 |
6.9 |
|
Refrigerant loss |
56.7 |
52.5 |
−7.4 |
|
Paper consumption |
23.3 |
19.0 |
−18.5 |
|
Business travel |
2.8 |
2.1 |
−26.2 |
|
|
329.9 |
265.1 |
−19.7 |
Definition:
Trends in CO2 emissions per square metre from all the emission sources included in the climate protection target compared to the reference year 2011.
Explanation:
We aim to reduce the emissions per square metre by 20 per cent between the reference year 2011 and 2020. Including the current reporting period, we have succeeded in cutting our emissions by 19.7 per cent and are therefore already close to achieving our target. The majority of this is attributable to the measures to reduce electricity consumption.
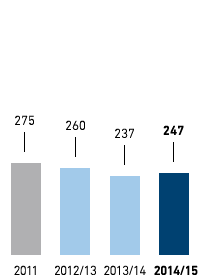
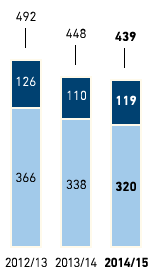
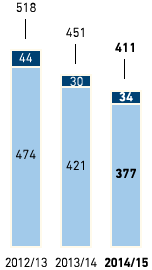
Electricity and heating energy consumption (in kWh per m2 selling space)
METRO GROUP
Germany
Western Europe
(excl. Germany)
Eastern Europe
Asia/Africa
Definition:
Locations’ energy consumption in relation to selling space. The energy consumption consists of electricity consumption and heating and cooling energy consumption (heating oil, natural gas, liquefied petroleum gas [LPG], emergency power generators and district heating/cooling).
Explanation:
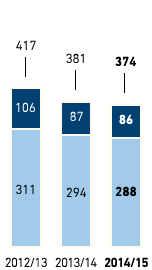
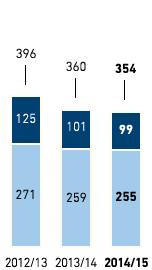
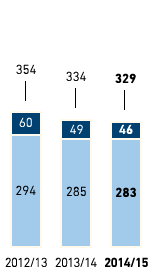
We continued to pursue our energy-saving programmes in the reporting period and invested in technical measures at all sales lines. In addition to technical investments, we focus on changing each and every employee’s behaviour and implement energy awareness programmes to this end. After all, our employees can make a major contribution to energy savings by adopting environmentally aware behaviour. This enabled us to make further reductions in our energy consumption per square metre of selling space.
In total, our direct energy consumption comprising heating oil, natural gas and LPG stood at 782,304 MWh in the reporting period. 3,207,752 MWh of electricity and district heating/cooling (indirect energy consumption) was used.
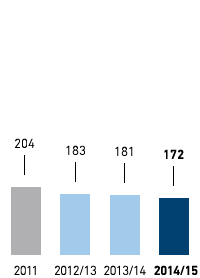
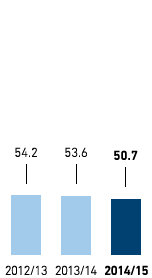
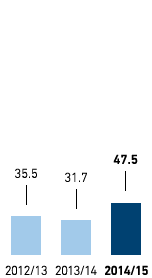
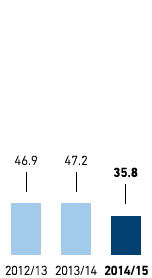
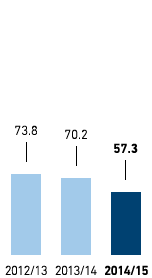
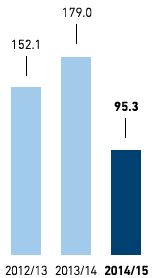
Refrigerant losses from commercial refrigeration
Greenhouse gas emissions in kg CO2 (CO2 equivalents) per m2 selling space
METRO GROUP
Germany
Western Europe
(excl. Germany)
Eastern Europe
Asia/Africa
Definition:
Greenhouse gas emissions in connection with the loss of refrigerants from commercial refrigeration systems (chilling and freezing, excluding scheduled refrigerant replacement, does not include refrigerant losses from air-conditioning).
Explanation:
Refrigerants are lost following emissions due to leaks or malfunctions caused by damage to pipes, for example. The Media-Saturn sales line has no commercial refrigeration systems.
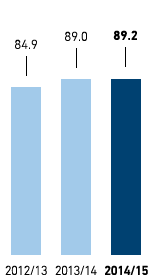
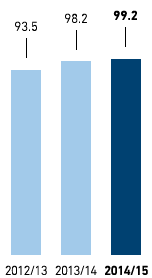
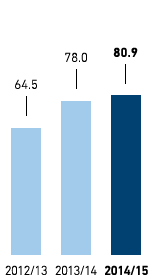
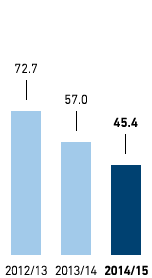
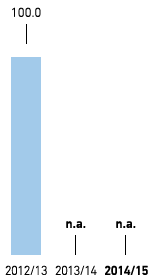
Proportion of eco-friendly paper (in %)
METRO GROUP
Germany
Western Europe
(excl. Germany)
Eastern Europe
Asia/Africa
Definition:
The following paper types are considered eco-friendly: newsprint (containing 65–100 per cent recovered paper fibres) and magazine paper (certified as coming from sustainably managed forests or made of pulp bleached without the use of chlorine and/or with a minimum recovered paper content of 20 per cent). The proportion of these types of paper is calculated in relation to the total quantity of paper purchased via METRO GROUP Advertising (MGA) for advertising material and brochures. Office paper and paper not procured centrally by the sales lines is not included.
Explanation:
We succeeded in further increasing the proportion of eco-friendly paper in the reporting period. MGA purchased a total of 182,827 tonnes centrally, while the sales lines procured a further 10,086 tonnes of paper on a decentralised basis. The proportion of paper made from recovered paper fibres increased to 67 per cent of the total volume. As of financial year 2013/14, no more volumes were purchased centrally in Asia by MGA.
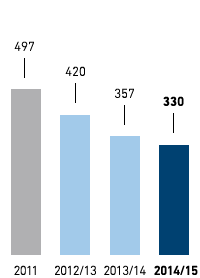
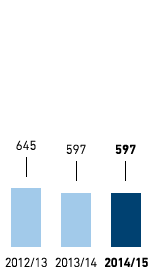
Water consumption (in l per m2 selling space)
METRO GROUP
Germany
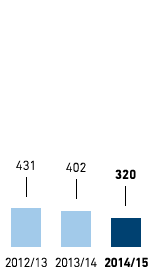
Western Europe
(excl. Germany)
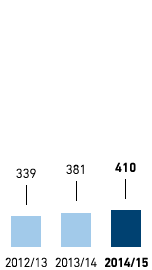
Eastern Europe
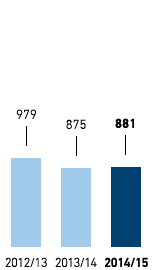
Asia/Africa
Definition:
Locations’ water consumption in relation to selling space.
Explanation:
In absolute terms, METRO GROUP used 6.4 million cubic metres of fresh water in the reporting period. At the warehouses, stores and back offices, water is primarily used for cleaning and sanitary facilities. In addition to this, water may be used for storing, transporting and selling food, for example for keeping live fish or making ice to chill fresh fish. Water is drawn from the public drinking water supply and is fed into the public sewage system as wastewater after use.
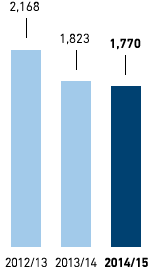
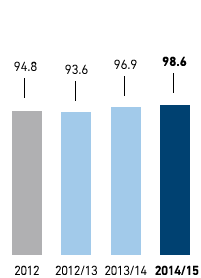
Own logistics fleet in Germany (with the proportion of Euro 5 and Euro 6 vehicles and average consumption per 100 km)
Number of trucks
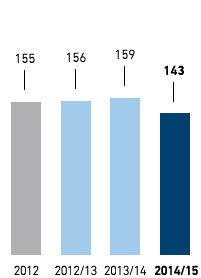
Proportion of Euro 5 or 6 (%)
Diesel fuel per 100 kilometres in litres
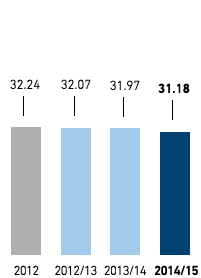
Definition:
Proportion of vehicles among the logistics fleet owned by METRO LOGISTICS Germany GmbH (MGL) in Germany which complies with the European emission standard Euro 5 or higher plus the average diesel consumption per 100 kilometres driven.
Explanation:
We are systematically switching to vehicles that emit fewer pollutants and have managed to increase the proportion of our vehicles that comply at least with the Euro 5 emissions standard to almost the entire fleet. At the same time, more than half of our vehicles comply with the Euro 6 standard.
Reliable figures on the number of kilometres driven are only available for Germany, which is why we only report this KPI for Germany.
Group-wide, the vehicles in the logistics fleet and company cars used 45.7 million litres of fuel in the reporting period. This corresponds to energy consumption of 1,617,567 GJ.