

Capital structure
Capital structure of METRO GROUP
€ million
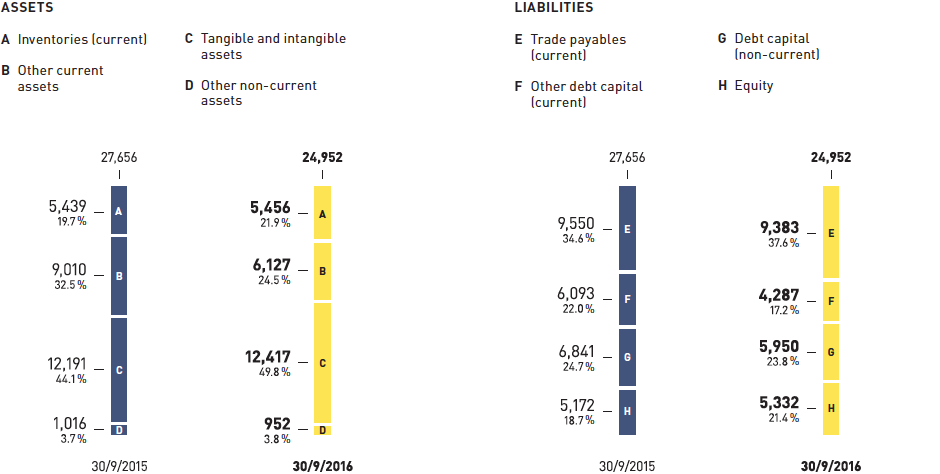
As of 30 September 2016, METRO GROUP’s balance sheet showed equity of €5.3 billion (30/9/2015: €5.2 billion). The increase is primarily due to the change in reserves retained from earnings which increased by €141 million compared with 30 September 2015. The increase in other reserves retained from earnings, which largely stemmed from profit for the period attributable to the shareholders of METRO AG, had a positive impact. In contrast, effects from the remeasurement of defined benefit plans and dividends paid reduced reserves retained from earnings.
The equity ratio stood at 21.4 per cent (30/9/2015: 18.7 per cent). The share of reserves retained from earnings in equity totalled 36.3 per cent compared with 34.7 per cent on 30 September 2015.
| Download XLS (22KB) |
€ million |
Note no. |
30/9/2015 |
30/9/2016 |
Equity |
5,172 |
5,332 |
|
Share capital |
|
835 |
835 |
Capital reserve |
|
2,551 |
2,551 |
Reserves retained from earnings |
|
1,793 |
1,934 |
Non-controlling interests |
|
−7 |
12 |
Net debt was reduced further by €0.2 billion and amounted to €2.3 billion as of 30 September 2016 (30/9/2015: €2.5 billion). This is calculated by netting financial liabilities, including finance leases of €4.8 billion (30/9/2015: €7.4 billion), with cash and cash equivalents according to the balance sheet of €2.4 billion (30/9/2015: €4.4 billion) as well as monetary investments of €90 million (30/9/2015: €424 million). In the reporting period, cash outflow from cash and cash equivalents as well as short-term financial investments essentially relates to the decline in financial liabilities (including finance leases), that is from bond redemptions, partial redemptions of promissory note loans and the reduction of liabilities to banks. As of 30 September 2015, cash and cash equivalents as well as short-term financial investments had included cash inflow from the sale of the Galeria Kaufhof group in Germany and Belgium including the associated real estate assets.
| Download XLS (22KB) |
€ million |
30/9/2015 |
30/9/2016 |
||
|
||||
Cash and cash equivalents according to the balance sheet |
4,415 |
2,368 |
||
Short-term financial investments1 |
424 |
90 |
||
Financial liabilities (incl. finance leases) |
7,366 |
4,759 |
||
Net debt |
2,527 |
2,301 |
||
As of 30 September 2016, non-current liabilities amounted to €6.0 billion (30/9/2015: €6.8 billion). The decline by €0.8 billion was essentially due to lower long-term financial liabilities totalling €3.8 billion (30/9/2015: €4.7 billion). The opposite effect was produced by the €144 million increase in provisions for post-employment benefits plans and similar obligations to €1.4 billion (30/9/2015: €1.3 billion). This is essentially due to the markedly lower actuarial interest rate.
As of 30 September 2016, METRO GROUP had current liabilities totalling €13.7 billion (30/9/2015: €15.6 billion). This reduction is primarily attributable to the decline in short-term financial liabilities by €1.7 billion (30/9/2016: €0.9 billion; 30/9/2015: €2.6 billion) stemming from bond redemptions, the partial repayment of promissory note loans and lower liabilities to banks.
Compared with 30 September 2015, the debt ratio declined by 2.7 percentage points to 78.6 per cent. At 69.7 per cent, the share of current liabilities in total liabilities was virtually unchanged after 69.6 per cent on 30 September 2015.
| Download XLS (23KB) |
€ million |
Note no. |
30/9/2015 |
30/9/2016 |
Non-current liabilities |
|
6,841 |
5,950 |
Provisions for post-employment benefits plans and similar obligations |
1,270 |
1,414 |
|
Other provisions |
492 |
383 |
|
Financial liabilities |
4,731 |
3,812 |
|
Other financial and non-financial liabilities |
206 |
191 |
|
Deferred tax liabilities |
142 |
150 |
|
Current liabilities |
|
15,643 |
13,670 |
Trade liabilities |
9,550 |
9,383 |
|
Provisions |
628 |
705 |
|
Financial liabilities |
2,635 |
947 |
|
Other financial and non-financial liabilities |
2,488 |
2,465 |
|
Income tax liabilities |
148 |
170 |
|
Liabilities related to assets held for sale |
194 |
0 |
For more information about the development of liabilities, see the notes to the consolidated financial statements in the numbers listed in the table. Information about contingent liabilities and other financial liabilities can be found in the notes to the consolidated financial statements in no. 45 – contingent liabilities and no. 46 – other financial liabilities.
For more information about the maturity, currency and interest rate structure of financial liabilities as well as the credit facilities, see the notes to the consolidated financial statements in no. 37 – financial liabilities.