

Earnings position
- Like-for-like sales at METRO GROUP climbed by 0.2 per cent in financial year 2015/16
- Due to negative currency and portfolio effects, reported sales for financial year 2015/16 decreased by 1.4 per cent to €58.4 billion (in local currency: +0.4 per cent)
- EBIT from continuing operations before special items: €1,560 million (2014/15: €1,511 million) in spite of negative currency effects of €70 million
- Profit for the period before special items: €727 million (2014/15: €688 million)
- Earnings per share before special items improved to €1.96 (2014/15: €1.91)
Financial and asset position
- Net debt declined by €0.2 billion to €2.3 billion (30/9/2015: €2.5 billion)
- Investments totalled €1.4 billion (2014/15: €1.4 billion)
- Cash flow from operating activities reached €1.6 billion (2014/15: €1.8 billion)
- Total assets amounted to €25.0 billion (30/9/2015: €27.7 billion)
- Equity: €5.3 billion (30/9/2015: €5.2 billion); equity ratio: 21.4 per cent (30/9/2015: 18.7 per cent)
- Long-term rating of BBB– (Standard & Poor’s)
Sales and earnings development
Group sales of METRO GROUP 2015/16
by region
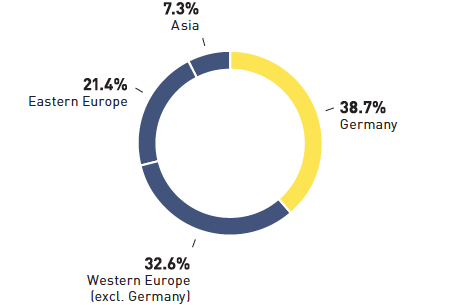
In financial year 2015/16, like-for-like sales at METRO GROUP grew by 0.2 per cent. This increase can be attributed mostly to positive developments at METRO Cash & Carry, while sales declined at Real. At €58.4 billion, reported sales were 1.4 per cent lower than a year earlier due to negative currency and portfolio effects. However, sales rose by 0.4 per cent in local currency.
Like-for-like sales in Germany rose by 0.2 per cent. Reported sales even grew by 0.6 per cent to €22.6 billion thanks to positive contributions from METRO Cash & Carry and Media-Saturn in particular. In contrast, sales at Real declined largely as a result of store closures.
Like-for-like sales in the international business increased by 0.2 per cent. International sales rose slightly by 0.2 per cent in local currency. Reported sales fell by 2.5 per cent to €35.8 billion due mostly to currency effects as well as store disposals and closures.
The international share of total sales stood at 61.3 per cent (2014/15: 62.0 per cent).
In Western Europe (excluding Germany), like-for-like sales declined by 0.7 per cent. Sales declined slightly by 0.2 per cent in local currency. Reported sales also declined by 0.2 per cent to €19.1 billion, which can be attributed mostly to the negative sales trend in Italy and Switzerland. In contrast, Spain and Belgium registered very positive sales developments.
Like-for-like sales in Eastern Europe increased by 0.8 per cent. Adjusted for currency effects, sales improved by 1.2 per cent. However, due to the adverse currency movements, reported sales fell by 6.4 per cent to €12.5 billion, with negative currency effects in Russia and Poland in particular weighing on sales. Positive sales trends were recorded in Hungary, Turkey, Serbia and Bulgaria in particular.
Like-for-like sales in Asia increased by 2.4 per cent. Sales fell slightly by 0.8 per cent in local currency. Reported sales declined by 1.2 per cent. This decline was exclusively due to the sale of the activities in Vietnam as their sales contribution was only included in the figures for the first quarter of 2015/16. Without Vietnam, sales in Asia would have increased markedly by 8.9 per cent thanks partly to the acquisition of Classic Fine Foods and very positive sales developments in India.
EBIT before special items amounted to €1,560 million (2014/15: €1,511 million). This figure contains income from the sale of real estate amounting to €162 million (2014/15: €154 million) and income from the dissolution of obligations for post-employment benefits plans of €42 million. Adjusted for negative currency effects of €70 million, EBIT before special items was €119 million higher than in the previous year. Reported consolidated EBIT totalled €1,513 million in financial year 2015/16, more than double the amount registered in the previous year (2014/15: €711 million). This strong increase was due in particular to non-cash impairment losses on goodwill at Real in the previous year (€446 million) as well as income from the sale of the activities in Vietnam during the reporting period (€446 million).
Development of group sales
by sales line and region
| Download XLS (24KB) |
|
|
|
Change in % compared with the previous year’s period |
|||||
|
|
|
|
|
|
|
||
|
2014/15 € million |
2015/16 € million |
in group currency (€) |
Currency effects in percentage points1 |
in local currency |
like-for-like sales in local currency |
||
|
||||||||
METRO Cash & Carry |
29,690 |
28,999 |
−2.3 |
−2.7 |
0.4 |
0.6 |
||
Media-Saturn |
21,737 |
21,869 |
0.6 |
−1.0 |
1.6 |
0.1 |
||
Real |
7,735 |
7,478 |
−3.3 |
0.0 |
−3.3 |
−1.1 |
||
Others |
56 |
72 |
– |
– |
– |
– |
||
METRO GROUP |
59,219 |
58,417 |
−1.4 |
−1.7 |
0.4 |
0.2 |
||
thereof Germany |
22,490 |
22,622 |
0.6 |
0.0 |
0.6 |
0.2 |
||
thereof international |
36,728 |
35,795 |
−2.5 |
−2.8 |
0.2 |
0.2 |
||
Western Europe (excl. Germany) |
19,090 |
19,054 |
−0.2 |
0.0 |
−0.2 |
−0.7 |
||
Eastern Europe |
13,318 |
12,472 |
−6.4 |
−7.6 |
1.2 |
0.8 |
||
Asia |
4,319 |
4,269 |
−1.2 |
−0.4 |
−0.8 |
2.4 |
||
Development of group EBIT and EBIT of the sales lines
| Download XLS (23KB) |
|
EBIT1 |
|||
|
|
|
||
€ million |
2014/15 |
2015/16 |
||
|
||||
METRO Cash & Carry |
1,050 |
1,043 |
||
Media-Saturn |
442 |
454 |
||
Real |
88 |
100 |
||
Others |
−63 |
−33 |
||
Consolidation |
−5 |
−5 |
||
METRO GROUP |
1,511 |
1,560 |
||
Net financial result and taxes
| Download XLS (23KB) |
€ million |
2014/15 |
2015/16 |
Earnings before interest and taxes EBIT |
711 |
1,513 |
Earnings share of non-operating companies recognised at equity |
2 |
3 |
Other investment result |
0 |
−4 |
Interest income/expenses (interest result) |
−282 |
−221 |
Other financial result |
−172 |
−124 |
Net financial result |
−452 |
−346 |
Earnings before taxes EBT |
259 |
1,167 |
Income taxes |
−480 |
−559 |
Profit or loss for the period from continuing operations |
−221 |
608 |
Profit or loss for the period from discontinued operations after taxes |
935 |
49 |
Profit or loss for the period |
714 |
657 |
Net financial result
The net financial result primarily comprises the interest result of €−221 million (2014/15: €−282 million) and the other financial result of €−124 million (2014/15: €−172 million). The interest result improved thanks, in particular, to the lower level of interest rates, declining debt and interest income from tax refunds relating to other periods. The positive change in other financial result of €48 million essentially resulted from lower negative currency effects, particularly in Russia and Kazakhstan, compared with the previous year.
Taxes
At €559 million (2014/15: €480 million), reported income tax expenses are €79 million higher than in the previous year and essentially concern deferred taxes.
In the reporting period, the group tax rate from continuing operations stood at 47.9 per cent (2014/15: 185.5 per cent). The high group tax rate in the previous year is essentially due to the deconsolidation of the department store business. Before special items, the rate amounted to 41.5 per cent (2014/15: 48.6 per cent). The group tax rate represents the relationship between recognised income tax expenses and earnings before taxes. Including discontinued operations, the group tax rate stood at 46.0 per cent (2014/15: 42.0 per cent). Before special items, the group tax rate including discontinued operations amounted to 41.5 per cent (2014/15: 43.7 per cent).
Profit or loss for the period and earnings per share
Profit for the period in financial year 2015/16 totalled €657 million, a decline of €57 million compared with the previous year’s figure (2014/15: €714 million). Profit for the period from continuing operations, in turn, rose by €829 million (2015/16: €608 million; 2014/15: €−221 million).
Net of non-controlling interests, profit for the period attributable to the shareholders of METRO AG totalled €599 million (2014/15: €672 million). This corresponds to a decline of €73 million.
In financial year 2015/16, METRO GROUP recorded earnings per share of €1.83 (2014/15: €2.06). The calculation for the reporting period continued to be based on a weighted number of 326,787,529 shares. Profit for the period attributable to the shareholders of METRO AG of €599 million was distributed according to this number of shares. There was no dilution from so-called potential shares in financial year 2015/16 or in the previous year.
At €1.96, earnings per share before special items are €0.05 higher than in the previous year (2014/15: €1.91). This result forms the basis for the dividend recommendation.
| Download XLS (25KB) |
|
|
|
|
Change |
|||
|
|
|
|
|
|
||
|
|
2014/15 |
2015/16 |
absolute |
% |
||
|
|||||||
Profit or loss for the period from continuing operations |
€ million |
−221 |
608 |
829 |
– |
||
Profit or loss for the period from discontinued operations after tax |
€ million |
935 |
49 |
886 |
– |
||
Profit or loss for the period |
€ million |
714 |
657 |
−57 |
−8.0 |
||
Profit or loss for the period attributable to non-controlling interests |
€ million |
42 |
58 |
16 |
39.7 |
||
from continuing operations |
€ million |
42 |
58 |
16 |
39.7 |
||
from discontinued operations |
€ million |
0 |
0 |
0 |
– |
||
Profit or loss for the period attributable to the shareholders of METRO AG |
€ million |
672 |
599 |
−73 |
−11.0 |
||
from continuing operations |
€ million |
−263 |
550 |
813 |
– |
||
from discontinued operations |
€ million |
935 |
49 |
−886 |
– |
||
Earnings per share (basic = diluted)1 |
€ |
2.06 |
1.83 |
−0.23 |
−11.0 |
||
from continuing operations |
€ |
−0.80 |
1.68 |
2.48 |
– |
||
from discontinued operations |
€ |
2.86 |
0.15 |
−2.71 |
– |
||
Earnings per share before special items1 |
€ |
1.91 |
1.96 |
0.05 |
2.4 |
||
from continuing operations |
€ |
1.48 |
1.96 |
0.48 |
31.8 |
||
from discontinued operations |
€ |
0.43 |
0.00 |
−0.43 |
– |
||
Liquidity (cash flow statement)
METRO GROUP’s liquidity is calculated on the basis of the cash flow statement. The cash flow statement serves to calculate and display the cash flows that METRO GROUP generated or employed during the financial year from operating, investing and financing activities. In addition, it shows the changes in cash and cash equivalents between the beginning and end of the financial year.
Cash inflow from operating activities in financial year 2015/16 amounted to €1,552 million (2014/15: €+1,846 million). Investing activities led to cash outflow of €4 million (2014/15: €+785 million). Compared with the previous year’s period, this represents a decrease in cash flow before financing activities of €1,083 million to €1,548 million. Cash outflow from financing activities totalled €3,584 million (2014/15: €−597 million).
For more information, see the Annual Report 2015/16.