
Capital structure
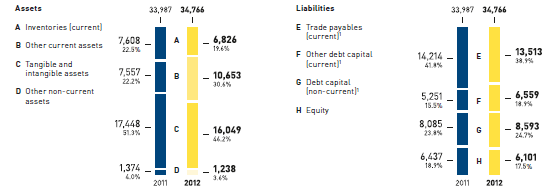
At the end of 2012, METRO GROUP’s balance sheet showed equity of €6,101 million compared to €6,437 million in the previous year. Reserves retained from earnings sank by €340 million. This reduction was largely due to the dividend payment for 2011 of €442 million. The equity ratio declined by 1.4 percentage points to 17.5 percent. The share of reserves retained from earnings in equity totalled 43.4 percent compared to 46.4 percent in the previous year. Non-controlling interests increased by €4 million to €77 million. This increase was largely due to profits attributable to non-controlling interests (€102 million) and dividends (€‑97 million).
Capital structure of METRO GROUP
€ million
| Download XLS (16 kB) |
|
€ million |
Note no. |
30/12/2011 |
30/12/2012 |
|
Equity |
6,437 |
6,101 | |
|
Share capital |
|
835 |
835 |
|
Capital reserve |
|
2,544 |
2,544 |
|
Reserves retained from earnings |
|
2,985 |
2,645 |
|
Non-controlling interests |
|
73 |
77 |
Net debt after netting of cash and cash equivalents according to the balance sheet as well as monetary investments with borrowings, including finance leases, totalled €3,245 million compared to €4,075 million in 2011. Non-current borrowings increased by €901 million to €6,736 million.
Current borrowings increased by €208 million to €1,814 million. During the financial year 2012, cash and cash equivalents increased by €1,944 million to €5,299 million.
| Download XLS (16 kB) |
|
€ million |
30/12/2011 |
30/12/2012 | ||||
| ||||||
|
Cash and cash equivalents according to the balance sheet |
3,355 |
5,299 | ||||
|
Monetary investments > 3 months < 1 year1 |
11 |
6 | ||||
|
Borrowings (incl. finance leases)2 |
7,441 |
8,550 | ||||
|
Net debt |
4,075 |
3,245 | ||||
The debt capital ratio increased by 1.4 percentage points to 82.5 percent. Current liabilities accounted for 70.0 percent of total debt compared with 70.7 percent in the previous year.
Non-current liabilities rose from €901 million to €6,736 million. This increase is largely attributable to bond issues with a volume of €1.7 billion. This was netted against maturity-induced reclassifications to current borrowings as well as reclassifications of liabilities from finance leases to “liabilities related to assets held for sale”. As of 31 December 2012, current borrowings totalled €1,814 million (previous year: €1,606 million). The increase is largely attributable to the issuance of commercial papers in the amount of €587 million and reclassifications from non-current borrowings. This was netted against redemptions of note loans totalling €550 million. Due mostly to reclassifications to “liabilities related to assets held for sale”, trade liabilities declined by €701 million to €13,513 million. In addition, this decline can be attributed to inventory optimisation measures at METRO Cash & Carry. The decline in income tax liabilities resulted primarily from tax payments made in the context of completed tax audits as well as a real estate transaction closed in the previous year. “Liabilities related to assets held for sale” totalled €900 million and resulted largely from the divestment of Real’s Eastern European business.
Information on the maturity, currency and interest rate structure of financial liabilities as well as on lines of credit can be found in the notes to the consolidated financial statements in no. 36 “Borrowings”.
| Download XLS (17 kB) |
|
€ million |
Note no. |
30/12/2011 |
30/12/2012 | ||||
| |||||||
|
Non-current liabilities |
|
8,085 |
8,593 | ||||
|
Provisions for pensions and similar commitments |
1,028 |
1,047 | |||||
|
Other provisions1 |
463 |
424 | |||||
|
Borrowings2 |
5,835 |
6,736 | |||||
|
Other financial and non-financial liabilities1, 2 |
602 |
227 | |||||
|
Deferred tax liabilities |
157 |
159 | |||||
|
Current liabilities |
|
19,465 |
20,072 | ||||
|
Trade liabilities1 |
14,214 |
13,513 | |||||
|
Provisions1 |
546 |
644 | |||||
|
Borrowings2 |
1,606 |
1,814 | |||||
|
Other financial and non-financial liabilities1, 2 |
2,705 |
2,910 | |||||
|
Income tax liabilities |
394 |
291 | |||||
|
Liabilities related to assets held for sale |
0 |
900 | |||||
Additional information on the development of liabilities is shown in the notes to the consolidated financial statements in the numbers listed in the table.